Table of contents
If you want to run a successful financial services business that can both operate within budget and successfully grow, it's essential to use sales forecasting. While sales forecasting can feel like a daunting—or sometimes unpleasant—process, it's actually a crucial step in business planning and goal setting. Here's why sales forecasting matters, and how to make sure you're doing this crucial part of data-driven sales right.
Why is sales forecasting important for a sales strategy?
Too often, sales forecasting is done subjectively or guided by the instincts of sales team members. In reality, however, accurate, data-driven sales forecasting—not hopeful or gut-based predicting—is key to making sure your sales team can do their job effectively and bring in (or manage) the right number of clients.
Sales forecasting is a key part of sales enablement. You want your sales team to have an accurate sense of what they can expect for the year—so they can ramp up efforts when needed, make sure their team is appropriately staffed, and more. For that reason, it's essential to use a data-driven approach.
To accurately predict the amount of demand you'll have for a fiscal year, it can help to look back at previous years' data. These numbers can include things like seasonal or event-based fluctuations; the types of opportunities that were most likely to convert; and the strongest and weakest parts of your sales process (and many, many more).
If you don't use data-based sales forecasting, your sales team may end up directing their energy to the wrong places, ultimately bringing in far fewer clients than expected—and resulting in financial problems for your company, as well as the inability to grow.
How to use a data-driven approach to forecast demand or sales for financial services
If you want to make sure you are doing the sales or demand forecasting process right, here are some key steps you can take:
- • Gather accurate, relevant historical data: to make sure your sales forecasting process is accurate, it's important to rely on historical data, and important to make sure you are looking at the right numbers. According to the experts at Pipedrive, some of the most important historical data to consider include historic close rates per sales rep and historic close rates for the whole sales team.
- • Look at information about current leads and trends: Historic information can help guide your forecasting, but you also need to consider how present circumstances can impact your sales. Some of the most important data to help guide your sales forecasting process include your current leads and where they are in the pipeline; current market trends and competition that could affect sales; how seasonality guides your business' performance, and more.
- • Layer on sales team intuition: it's not wholly wrong to use the intuition of sales team members when creating your sales forecast. It's just not what should be at the core of your predictions when it comes to sales. Once you've looked at data to create a fact-based annual sales forecast, your sales experts can tweak and refine based on the specialty, and expert knowledge they have from selling in the field.
How to use pipeline velocity for sales forecasting
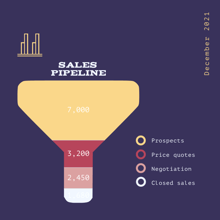
Pipeline velocity is an important metric that can help you with systematic selling. Just like regular velocity, pipeline velocity measures the rate at which your leads move through your pipeline.
To find pipeline velocity, you take the number of qualified leads you have in your pipeline, multiply it by the usual win rate percentage of your sales team and the average size of your deals in dollars, and then divide that number by the time (in days) it takes you to complete an entire sales cycle.
For example, let's say an investment brokerage currently has 100 qualified leads. Each closed deal usually garners $5,000 in annual commissions, and the sales team closes deals at a 25% win rate. The amount of time it takes a lead to go from lead to paying client, on average, is 28 days. So you'd multiply 100x5,000x.25, which would give you 125,000. Then you'd divide 125,000 by 28 and get 4,464.29. This means that the brokerage's pipeline velocity, or the amount of revenue coming through their pipeline daily is $4,464.29—and gives them a good idea about how much money they have to spend on sales.
Using pipeline velocity when forecasting is a more accurate and less optimistic way to guide your forecasting since it takes into account real numbers: the actual percentage of deals closed, the actual number of leads and dollars brought in, and the actual time it takes for selling.
More helpful info on sales forecasting
If you want to make sure your financial services business masters sales intelligence and properly forecasts sales, here are some more helpful resources that can guide your process:
- • 10 Simple Strategies for Creating a Better Sales Forecasting Model
- • The Definitive Guide to Data-Driven Sales Forecasting
- • How to Forecast Demand for a Scaling Financial Services Business
- • 6 Sales Reports to Improve Your Forecast
Alternatively, if you want more hands-on, personalized guidance for your sales steam, reach out to Learners.ai for a consultation today. Our team can help you define your sales processes, fill your pipeline, perfect your data-driven marketing, and make sure you meet all your quotas—so you can keep your customers happy, and you can keep watching your business thrive.


